Largest Contentful Paint (LCP)
LoadingMarks when the biggest element in view, often a hero photo or headline block, has fully painted. Google sets the bar at 2.5 seconds, while oversized photos and sluggish servers cause most failures.

Speed Optimization
Website speed optimization for Palo Alto businesses, measured the way customers actually load your pages: on a phone, often while moving between a train platform, an office and a downtown sidewalk.
A lot of Palo Alto searching happens in transit. For example, the Palo Alto Caltrain station averaged 3,603 weekday riders in fiscal 2025, and searches such as “restaurants near palo alto caltrain station” or “palo alto coffee shops to work” are typed on phones between meetings, on platforms and on bikes paused at a corner. Because signal on the move is uneven, a page that needs several seconds to show anything loses people who were ready to choose.
Many local sites are also heavier than they look. Restaurant menus posted as large images or PDFs, listing pages with dozens of full-size photos of Eichler homes, booking widgets, chat bubbles, map embeds and several tracking tags all compete for the same connection. On a fast office network none of it feels slow. On a phone, however, it adds up.
Speed also feeds into Google’s systems, since its Core Web Vitals documentation describes loading data drawn from real Chrome visits, and page experience is one of many signals it weighs. Some of your visitors will even run a Lighthouse test themselves, because this is that kind of town. So our website speed optimization aims for pages that pass with real visitors, rather than only in a lab.
Search demand
We gathered these Google suggestions with US settings in October 2026. Site speed itself does not appear in Palo Alto’s suggestions; instead, these searches send people, on phones, to the photo-rich and widget-heavy pages local businesses tend to have.
Nothing that sells for you has to go. Instead, size the hero image to the screen, serve it as WebP or AVIF with priority, publish the menu as text rather than a scan, and let third-party widgets wake up after the page is usable. As a result, it looks the same and arrives far sooner. We begin with your busiest pages and judge success by real-visitor data.
Common causes
A slow site usually has several of these at once, rather than just one.
A photographed menu can weigh more than the rest of the page, cannot be read by search engines, and forces phone users to pinch and zoom. By comparison, text with simple styling is lighter and easier to read.
A single camera-sized image shown a few hundred pixels wide can make up most of a page’s weight. However, resizing and modern formats remove most of it with no visible loss.
Chat widgets, review carousels, booking tools, heat maps and several analytics tags each add requests and processing. So we keep the ones you use and delay them until the page is ready.
A live map or video player near the top of the page pulls in a lot of code before the visitor asks for it. Instead, a lightweight preview that loads the real thing on tap is usually enough.
When the server is slow to answer, every later step on the page waits for it. Caching hides part of that delay, although moving to a better host is sometimes the only real cure.
Three measurements
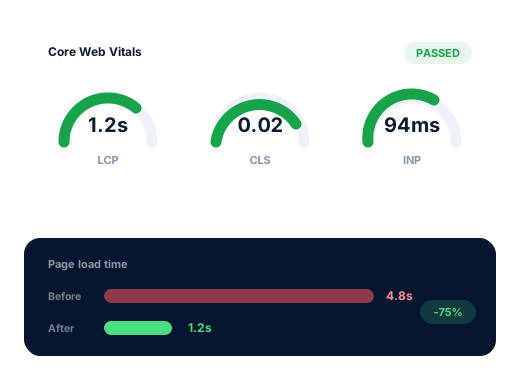
These numbers are pooled from real Chrome sessions across a rolling 28-day window. To pass a metric, at least three-quarters of those sessions have to land inside its threshold.
Marks when the biggest element in view, often a hero photo or headline block, has fully painted. Google sets the bar at 2.5 seconds, while oversized photos and sluggish servers cause most failures.
Measures the delay between a tap or click and the screen visibly responding, for example when a visitor opens the menu or a booking calendar. Google wants 200 milliseconds or under, and bulky chat, carousel and ad scripts are the usual drag.
Tracks how far content lurches as the page assembles, the reason a thumb meant for “Directions” lands on “Call”. Anything under 0.1 passes, so holding room open for images, banners and embedded widgets stops the lurching.
The work
Before we change a thing, your top pages get their mobile scores, field data and total weight logged, which keeps the later comparison honest.
Every photo is cut to the width it actually displays at, compressed and converted to WebP or AVIF for browsers that support them. It is then fetched only when a visitor scrolls near.
Menus, price lists and schedules rebuilt as styled text that loads quickly and can be indexed, with a printable version if you want one.
Unused plugins removed, while chat, review and tracking scripts wait until the page can be used.
Caching configured at both the server and the browser to match how your host works, plus a CDN in cases where it earns its keep.
A fresh measurement the day changes go live, then another a month on, when Google’s real-visitor numbers have had time to reflect them.
Done carefully
Standards we keep for every Palo Alto client, listed so you can hold us to them.
Speed stops visitors bouncing. Whether they pick you after that rests on your words, your work and what customers write about you.
Page experience is one signal among many, so we present it that way. Once your pages pass, we tell you and point to where effort would help more, such as service pages or your Business Profile. Website speed optimization is a one-time, fixed quote after an audit.
Ask us about your business
How we work
Every Palo Alto client goes through the same four steps, whatever they sell.
We review your site, your Business Profile and the competitors ahead of you, sampling rankings from several points around Palo Alto.
We choose the searches worth winning, assign each one a single page and explain the reasoning.
Listing, site and content work, beginning with the fixes most likely to move leads soonest.
Every month: leads, positions, what changed and why, and what we tackle next.
Questions
Paste a page address into PageSpeed Insights, Google’s free tool, and read the mobile tab, especially the real-user section at the top. Then switch your phone off wifi and load your busiest page cold, as a stranger would.
Often, yes, because PDFs and photographed menus are slow on phones and hard for search engines to understand. A text menu page stays quick, searchable and easy to update, and we can keep a PDF link for anyone who wants to print it.
Lab tools such as Lighthouse run one simulated visit, so their scores vary from run to run. Google’s Core Web Vitals assessment, by contrast, uses 28 days of real Chrome visits, and that is the figure we work toward.
Occasionally, by a small margin, when rival pages are otherwise neck and neck. The surer gain is that more people stick around long enough to read and make contact.
On a small site the fixes typically take a week or two. After that, Google’s real-visitor data lags by about four weeks before it shows the improvement.
A one-off fixed fee, quoted once the audit has pinned down the causes. From then on, keeping pages quick falls under routine care in every plan, from Starter at $300 a month to Growth at $500 and Pro at $700, in US dollars.
Further reading
Longer reads on this topic for Palo Alto owners who like to see the reasoning.
Each service can be hired on its own, and plenty of clients start with a single one.
Customers in each field search in their own vocabulary, so each page rests on its own research.
We check your rankings from Downtown to Barron Park, name the businesses ahead of you and pick out the fixes that would count most. No charge.
Get my free audit